Discovering 3: Our Quantified Self
Discovering 3: Our Quantified Self
Feb 21: Trace your quantified self: to prep for this activity, we’ll skim together in class “Big Mother is Watching You” and explore the Quantified Self website. Some ideas for discovering/tracing your quantified self:
-
- Google your name in a web search. Perhaps try in incognito mode too: every browser has an option for this if you Google “how do I use incognito mode in X browser (Chrome, Firefox, Safari, etc)” Are there differences in the results from when
 you Google as yourself and when you Google in incognito mode?
 - Check My Activity in google
- Check your screen time on your phone. The amount of time spent on various apps on your phone. The stats in your activity or health apps.
- Do you notice likes in Instagram or other social media? Number of followers?
- Do you keep track of your sleep? Your workouts? Do you go into detail on workouts like keeping track of splits on a run?
- I was diagnosed with AFib last year, so I keep careful track of my heart rate all the time. My apple watch has my heart rate right on the front; it’s a strange thing to know your heart rate all the time. Are there health things you keep track of? How?
- What about school data? Do you keep track of scores, grades, etc?
- Other ideas? Your gas mileage? Your hours worked? The number of books read?
- Google your name in a web search. Perhaps try in incognito mode too: every browser has an option for this if you Google “how do I use incognito mode in X browser (Chrome, Firefox, Safari, etc)” Are there differences in the results from when
Ultimately, choose some things that you track and collect some data to contribute to our class’ data set (similar to what we did with our literacy tracings).
 Feb 28: write or create artifact
- An informal blog (the Big Mother opening could be a model for getting started on a blog post): reflections on your quantified self.
- Another blog idea: You could compare what your school data says about you and what your school data leaves out? You might consider thinking through all the stats from your college experience: how many tests, how many classes attended (and missed), how many grades, how many hours working or studying? And then what is not accounted for in these numbers: friendships, commutes, homesickness, new places visited. How might you represent the full college experience? Perhaps stats on one side of a page and film or images on the other? Perhaps try out Piktochart? Or Adobe Spark? You could represent these competing stats/reality in a series of memes (“what people think I do vs what I really do”)
- Use the Data Detox kit and then write a reflection on the process.
- An infographic (like the Quantify Yourself chart in the Big Mother article). Piktochart could be a great resource for this. You could then add a short piece of writing to expand on the chart: what does your data explain and not explain about your quantified self?
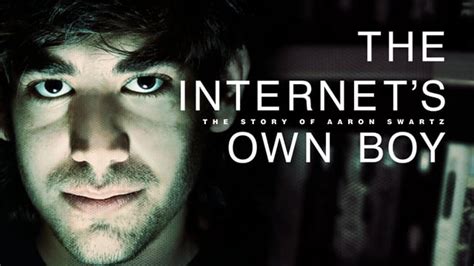
- Watch The Internet’s Own Boy (<–this is the trailer) and write a reflection. Link to full film
- A short film: alternating some day-in-the-life style video perhaps with some narrative and images from you. I would keep this under 3 minutes. And I would compose a film, not simply talk to a webcam.
- A piece of art
- A game: design a gaming experience for us that immerses the player into a quantified self. You might even use a site like Super Better to create your game.
- Slam poetry or original song
- Some other cool idea you have
 Website: